3QFY2019 Result Update | Steel & Power
February 7, 2019
Jindal Steel & Power
BUY
CMP
`135
Target Price
`249
Investment Period
12 Months
Performance Update
INR Cr.
Q3FY19
Q3FY18
% chg. (yoy) Q2FY19
% chg. (qoq)
Stock Info
Total Income
9580
6993
37
9983
-4
Sector
Steel & Power
Market Cap (` cr)
12,560
Operating profit
2077
1607
29.30
2207
-6
Net Debt (` cr)
39,197
OPM (%)
21.7
23.3
-158.8
22.1
-43
Beta
2.6
52 Week High / Low
279/125
PAT
-86
-123
NA
42
-307
Avg. weekly Volume
1,331,278
Face Value (`)
1
Source: Company, Angel Research
BSE Sensex
36,975
Nifty
11,062
Reuters Code
JNSP.BO
Steel: For Q3FY2019, on standalone basis, JSPL has delivered strong performance and
Bloomberg Code
JNSP IN
registered a revenue growth of 58% yoy to ~`6,754cr. The company’s EBIDTA also
Shareholding Pattern (%)
improved by 61% yoy to `1,480cr owing to better realizations. Further, EBIDTA/tonne
Promoters
58.7
also improved from
`11,344cr in 2QFY2019 to
`12,333cr in 3QFY2019. On
MF / Banks / Indian Fls
6.9
consolidated basis, revenue grew by 37% yoy to `9,580cr as against `6,993cr in
FII / NRIs / OCBs
19.2
Indian Public / Others
15.2
3QFY2018. In 3QFY2019, Jindal Shadeed recorded a production of 0.46mn tonnes of
crude steel, up by 10% yoy. EBITDA for Jindal Shadeed stood at $32mn for the quarter,
Abs.(%)
3m
1yr
3yr
down 49% yoy owing to weak global steel prices.
Sensex
5.6
5.4
27.0
JSPL
(26.9)
(46.0)
(12.8)
Going forward, we expect EBIDTA/tonne to sustain in the same range owing to stable
global steel prices and increasing domestic consumption of steel. However, recent inch-
up in iron ore prices may impact operating margins, but at same time, it will also
support steel prices. As far as JSPL is concerned, increasing input prices can be offset
against improving utilization at Angul plant.
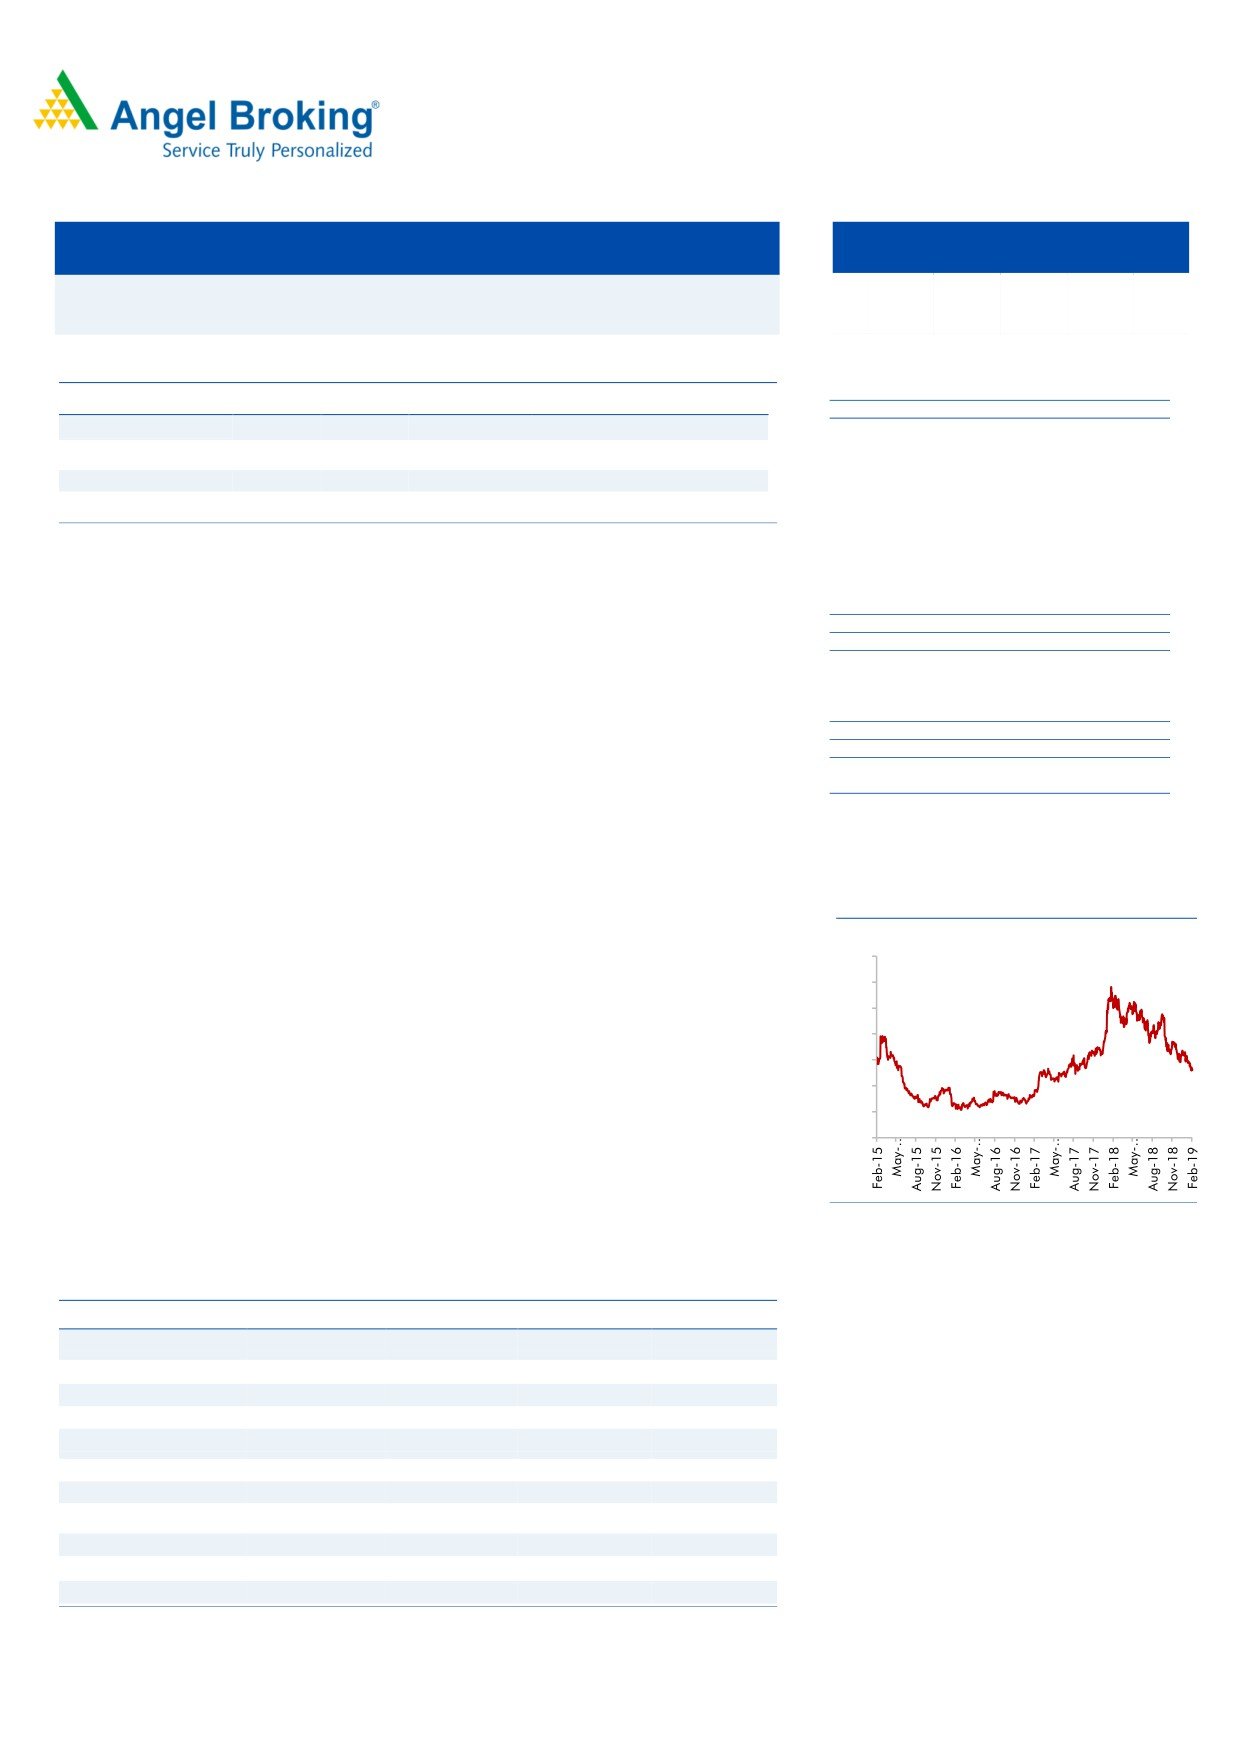
3years performance chart
JPL: During Q3FY2019, revenue in power segment witnessed de-growth of 14% yoy to
350
`1,004cr vs. `1,172cr in the corresponding quarter previous year. Poor coal availability
300
continued to impact the generation volumes. Generation volumes for the quarter stood
250
at 2,609mn units, down 12% yoy, while EBITDA margin contracted by 318bps yoy to
27% due to higher coal costs and lower generation volumes.
200
150
100
Outlook & Valuation: Given the ongoing global trade concerns, we expect steel prices to
remain range bound. However, we project that domestic demand will continue to
50
remain positive for steel and power sectors on long term basis, and expect JSPL to
0
perform well in coming years along with the ramp up of Angul plant and realizations in
steel segment. We also anticipate that power segment will perform well on account of
improving power demand situation and various efforts by GoI for availability of fuel to
power generators. We maintain our Buy recommendation on JSPL with revised target
Source: Company, Angel Research
price of `249 with a potential upside of 84%.
Key Financials
Y/E March (` cr)
FY17
FY18
FY19E
FY20E
Net Sales
20,409
27,383
38,967
41,512
% chg
14
34
42
7
EBIDTA
4,337
5,882
8,763
10,175
% chg
35
36
49
16
EBITDA (%)
21%
21%
22%
24%
EPS (Rs)
(26)
(17)
9
19
P/E (x)
-
-
15
7
P/BV (x)
0.4
0.4
0.4
0.4
RoE (%)
-
-
2.7
5.6
Kripashankar Maurya
RoCE (%)
0.6
2.9
6.6
8.8
022-39357800 Ext: 6004
EV/EBITDA
11.9
8.7
5.7
4.5
Source: Company, Angel Research
Valuation done based on 6th February, 2019 closing price
Please refer to important disclosures at the end of this report
1
JSPL | 3QFY2019 Result Update
Exhibit 1: 3QFY2019 Performance
In Cr
Q3FY19
Q3FY18
Q2FY19
YOY %
QOQ%
Net Sales
9580
6904
9983
38.8%
-4%
Total Income
9566
6993
9982
37%
-4%
Total Expenditure
7488
5386
7775
39%
-4%
Raw Material Consumed
3856
2217
3999
74%
-4%
Stock Adjustment
-371
85
78
-538%
-573%
Purchase of Finished Goods
277
54
280
408%
-1%
COGS
3761
2356
4357
60%
-14%
Employee Expenses
279
241
269
16%
4%
Other Expenses
3527
2789
3222
26%
9%
Capitav sales
-79
0
-63
Raw Material Consumed
40%
32%
40%
Stock Adjustment
-4%
1%
1%
Purchase of Finished Goods
3%
1%
3%
COGS
39%
34%
44%
Gross Margin %
39%
34%
44%
Employee Expenses
3%
3%
3%
Other Expenses
37%
40%
32%
EBITDA
2077
1607
2207
29%
5%
Other Income
14.77
1.0
0.0
1320%
#DIV/0!
Interest
1042
967
973
8%
7%
PBDT
1050
641
1234
64%
-15%
Depreciation
1036
963
1039
8%
0%
PBT
14
-323
195
-104%
-93%
Exceptional Iteam (gain/loss)
0
0
0
NA
Tax
100
-200
154
-150%
-18%
PAT
-86
-123
42
-30%
24%
Ratios
BPS
BPS
EBITDA margin (%)
21.7
23.3
22.11
-159
-43
PAT margin %
0
0
0.42
1
-43
Tax rate %
NA
62
78.71
NA
NA
Source: Company, Angel Research
Company background
JSPL is part OP Jindal Group with presence in steel, power and mining sectors.
JSPL has capacity of
10.6 MTPA crude steel and 3,400MW of power
generation capacity through its subsidiary Jindal Power Limited (JPL).
JSPL operates the largest coal based sponge iron plant in the world and has
an installed capacity of 3 MTPA (million tonnes per annum) of steel at Raigarh
in Chhattisgarh. Moreover, it has set up a 0.6 MTPA wire rod mill and a 1
MTPA capacity bar mill at Patratu, Jharkhand, a medium and light structural
mill at Raigarh, Chhattisgarh and a 2.5 MTPA steel melting shop and a plate
mill to produce up to 5 meter-wide plates at Angul, Odisha. In Oman (Middle
East), the company has a 2 MTPA integrated steel plant with a 1.5 MTPA gas-
based Hot Briquetted Iron (HBI) plant.
February 7, 2019
2
JSPL | 3QFY2019 Result Update
JSPL has installed power capacity of 3,400MW through its wholly owned
subsidiary Jindal Power Limited (JPL). In FY18, JPL had Power Purchase
Agreement (PPA) of 1,350MW and it operates at 35-37% utilization.
Valuation Assumption
We value the stock on Asset based approach, valuing each segment’s assets at
discount to its peer companies, while applying multiple to respective asset. We
arrive at the SOTP based target price of ` 249.
Exhibit 2: Asset Based SOTP Valuation
Segments
Capacity
Multiple (X)
Total INR Cr.
Power- (EV/MW)*
3,400
4
13,600
Steel- (EV/Tonne)#
10.6
4,800
50,880
Consol Enterprise Value (A)
64,480
Debt FY19 (Sept) (B)
42,605
Equity Value ( C)= (A)-(B)
25,283
No of share (D)^
102
Value per share INR (C)/(D)
249
CMP
130
Upside
91%
Source: Company, Angel Research
Note:
*Disinvestment announced in May 2016 by JSW Energy to acquire 1,000MW
(4X250) Tamnar Thermal Power Plant from JSPL.
Valuing Power segment by applying multiple of `4cr/MW at 21% discount to JSW
Energy’s of EV `4.9cr/MW.
# Valuing the steel segment by applying multiple of `4800cr/MTPA at 22%
discount to JSW Steel’s EV/Tonne of ` 5,962cr/MTPA.
^ Factoring issuance of warrant shares.
Exhibit 3: Peer Asset Valuation
Particular
JSW steel Tata Steel JSW Energy Tata power
NTPC
EV/Tonne
5,962
5,898
EV/MW
4.7
5.9
4.6
Crude steel Capacity
18
28
(MTPA)
Power Generation Capacity (MW)
4,451
10,757
52,946
Source: Company, Angel Research
February 7, 2019
3
JSPL | 3QFY2019 Result Update
Exhibit 4: Income statement
Y/E March (` cr)
FY17
FY18
FY19E
FY20E
Total operating income
21,051
27,383
38,967
41,512
% chg
15
30
42
7
Total Expenditure
16,714
21,502
30,203
31,901
Raw Material
6,535
9,378
12,896
13,739
Personnel
914
956
1,361
1,450
Purchase of finished goods
265
324
385
416
Others Expenses
8,999
10,843
15,561
16,090
EBIDTA
4,337
5,882
8,763
10,175
% chg
35
36
49
16
(% of Net Sales)
20.6
21.5
22.5
24.2
Depreciation& Amortisation
3,949
3,883
4,114
4,234
EBIT
388
1,999
4,650
5,941
% chg
(145)
415
133
28
(% of Net Sales)
2
7
12
14
Interest & other Charges
3,441
3,866
3,557
3,220
Other Income
10
3
3
3
Extraordinary Items
(372)
(577)
-
-
Recurring PBT
-2,671
-1,287
1,096
2,388
% chg
(28)
(52)
(185)
118
Tax
-503
-240
252
549
PAT (reported)
-2,168
-1,047
844
1,839
% chg
(24)
(52)
(181)
118
(% of Net Sales)
-10.3
-3.8
2.2
4.4
Basic & Fully Diluted EPS (Rs)
-26
-17
9
19
% chg
(18)
(36)
(152)
118
Source: Company, Angel Research
February 7, 2019
4
JSPL | 3QFY2019 Result Update
Exhibit 5: Balance sheet
Y/E March (` cr)
FY17
FY18
FY19E
FY20E
SOURCES OF FUNDS
Equity Share Capital
92
97
97
97
Reserves& Surplus
29,959
30,283
31,127
32,966
Shareholders Funds
30,051
30,380
31,224
33,063
Equity Share warrant
5
5
5
Minority Interest
647
440
338
235
Total Loans
39,958
39,198
38,824
34,362
Other Liabilities
6,430
6,074
8,662
8,490
Total Liabilities
77086
76097
79053
76202
APPLICATION OF FUNDS
Net Block
66,934
69,550
67,732
65,997
Capital Work-in-Progress
8,714
3,877
1,947
1,850
Investments
368
146
146
146
Long Term Loans & Advances
-
-
Current Assets
13,022
14,313
20,517
21,045
Inventories
3,599
4,960
6,864
6,536
Sundry Debtors
1,717
1,826
2,600
2,770
Cash & Cash Equivalent
477
468
992
1,389
Loans & Advances
6,841
6,589
9,633
9,640
Investments & Others
387
471
429
450
Current liabilities
13,489
13,133
18,759
19,349
Net Current Assets
-467
1,180
1,758
1,434
Other Non Current Asset
1,537
1,343
7,470
6,775
Total Assets
77086
76097
79053
76202
Source: Company, Angel Research
February 7, 2019
5
JSPL | 3QFY2019 Result Update
Exhibit 6: Cash Flow
Y/E March (` cr)
FY17
FY18
FY19E
FY20E
Profit before tax
(2,671)
(1,287)
1,096
2,388
Depreciation
3,949
3,883
4,114
4,234
Change in Working Capital
Interest / Dividend (Net)
3,441
3,866
3,557
3,220
Direct taxes paid
(503)
(240)
252
549
Others
2,582
(516)
(1,163)
312
Cash Flow from Operations
6,799
5,706
7,855
11,039
(Inc.)/ Dec. in Fixed Assets
(2,354)
(2,000)
(2,499)
(2,498)
(Inc.)/ Dec. in Investments
356
175
(46)
(45)
Cash Flow from Investing
(1,998)
(1,825)
(2,545)
(2,543)
Issue of Equity
0
1,200
-
-
Inc./(Dec.) in loans
-2875.18
-760.44
-374.00
-4462.00
Others
(2,181)
(4,305)
(4,207)
(3,300)
Cash Flow from Financing
(5,057)
(3,866)
(4,581)
(7,762)
Inc./(Dec.) in Cash
(256)
15
730
397
Opening Cash balances
503
247
262
992
Closing Cash balances
247
263
992
1,389
Source: Company, Angel Research
February 7, 2019
6
JSPL | 3QFY2019 Result Update
Exhibit 7: Key Ratio
Y/E March
FY2017
FY2018
FY2019E FY2020E
P/E (on FDEPS)
-
-
14.9
6.8
P/CEPS
7.1
4.4
2.5
2.1
P/BV
0.4
0.4
0.4
0.4
EV/Sales
2.5
1.9
1.3
1.1
EV/EBITDA
11.9
8.7
5.7
4.5
EV / Total Assets
0.7
0.7
0.6
0.6
Per Share Data (Rs)
EPS (Basic)
-26.2
-16.8
8.7
19.0
EPS (fully diluted)
-25.0
-16.0
8.3
18.1
Cash EPS
18.4
29.3
51.2
62.7
DPS
0.0
0.0
0.0
0.0
Book Value
310
314
323
342
Returns (%)
ROCE
0.6
2.9
6.6
8.8
Angel ROIC (Pre-tax)
0.6
2.8
6.1
8.2
ROE
-8.5
-5.3
2.7
5.6
Turnover ratios (x)
Inventory / Sales (days)
64
67
65
60
Receivables (days)
31
25
25
25
Payables (days)
52
56
56
56
Working capital cycle (ex-cash) (days)
43
35
33
28
Source: Company, Angel Research
February 7, 2019
7
JSPL | 3QFY2019 Result Update
Research Team Tel: 022 - 39357800
DISCLAIMER:
Angel Broking Limited (hereinafter referred to as “Angel”) is a registered Member of National Stock Exchange of India Limited, Bombay
Stock Exchange Limited, Metropolitan Stock Exchange Limited, Multi Commodity Exchange of India Ltd and National Commodity &
Derivatives Exchange Ltd It is also registered as a Depository Participant with CDSL and Portfolio Manager and Investment Adviser with
SEBI. It also has registration with AMFI as a Mutual Fund Distributor. Angel Broking Limited is a registered entity with SEBI for Research
Analyst in terms of SEBI (Research Analyst) Regulations, 2014 vide registration number INH000000164. Angel or its associates has not
been debarred/ suspended by SEBI or any other regulatory authority for accessing /dealing in securities Market. Angel or its
associates/analyst has not received any compensation / managed or co-managed public offering of securities of the company covered
by Analyst during the past twelve months.
This document is solely for the personal information of the recipient, and must not be singularly used as the basis of any investment
decision. Nothing in this document should be construed as investment or financial advice. Each recipient of this document should make
such investigations as they deem necessary to arrive at an independent evaluation of an investment in the securities of the companies
referred to in this document (including the merits and risks involved), and should consult their own advisors to determine the merits and
risks of such an investment.
Reports based on technical and derivative analysis center on studying charts of a stock's price movement, outstanding positions and
trading volume, as opposed to focusing on a company's fundamentals and, as such, may not match with a report on a company's
fundamentals. Investors are advised to refer the Fundamental and Technical Research Reports available on our website to evaluate the
contrary view, if any
The information in this document has been printed on the basis of publicly available information, internal data and other reliable
sources believed to be true, but we do not represent that it is accurate or complete and it should not be relied on as such, as this
document is for general guidance only. Angel Broking Limited or any of its affiliates/ group companies shall not be in any way
responsible for any loss or damage that may arise to any person from any inadvertent error in the information contained in this report.
Angel Broking Limited has not independently verified all the information contained within this document. Accordingly, we cannot testify,
nor make any representation or warranty, express or implied, to the accuracy, contents or data contained within this document. While
Angel Broking Limited endeavors to update on a reasonable basis the information discussed in this material, there may be regulatory,
compliance, or other reasons that prevent us from doing so.
This document is being supplied to you solely for your information, and its contents, information or data may not be reproduced,
redistributed or passed on, directly or indirectly.
Neither Angel Broking Limited, nor its directors, employees or affiliates shall be liable for any loss or damage that may arise from or in
connection with the use of this information.
Disclosure of Interest Statement
Jindal steel & Power
1. Financial interest of research analyst or Angel or his Associate or his relative
No
2. Ownership of 1% or more of the stock by research analyst or Angel or associates or
No
relatives
3. Served as an officer, director or employee of the company covered under Research
No
4. Broking relationship with company covered under Research
No
February 7, 2019
8